
I love coffee, and I deeply appreciate the different roast levels, brew methods, and bean origins that all come together to make coffee as luxurious and interesting as fine wines. I’ve been a coffee snob for a little over a decade now, but just recently discovered the sublime art of roasting my own coffee beans in my own garage. Many professional roasters recommend starting on the exact setup I’m using, and I see why. It’s surprisingly simple, quick, and the quality of coffee is stunningly good. This post is not meant to be a comprehensive tutorial; I just want to share the beginning of my roasting story and how I am bringing my engineering mindset to the scene.
Roasting Setup
I’ve wanted to start roasting since… forever. I’ve heard of this hilariously simple roasting method, but until recently never took the plunge. I was totally surprised when a new friend showed me his setup and how utterly simple (and quick!) the roasting process was… and I ordered my unit that very night and was drinking espresso from my home-roasted beans within a week.
I’m using an old-school Poppery II popcorn popper machine that I found on eBay for $35. It even came with a small bag of green beans–the last guy was a roaster, too! The trick is to get a unit that has the helical air vents (see image) that cause the beans to swirl around during heating.


Figure 1. Left: Roaster and thermocouple setup. Right: Helical air vents in the Poppery II roaster.
With this setup, it’s real simple: the 1250W popper turns on and gets right down to work. You don’t really have control over anything except how much beans you put in. Turns out this matters since more beans = more initial mass = more inertia that can inhibit helical motion. The helical motion is important so the beans get roasted evenly. I found that about 70-80g (1/2 dry cup) of green beans works well for most beans.
So now what? Figure 2 shows the chart I use as a roasting guide:

Figure 2. Roasting chart from Sweet Maria’s Coffee [1]
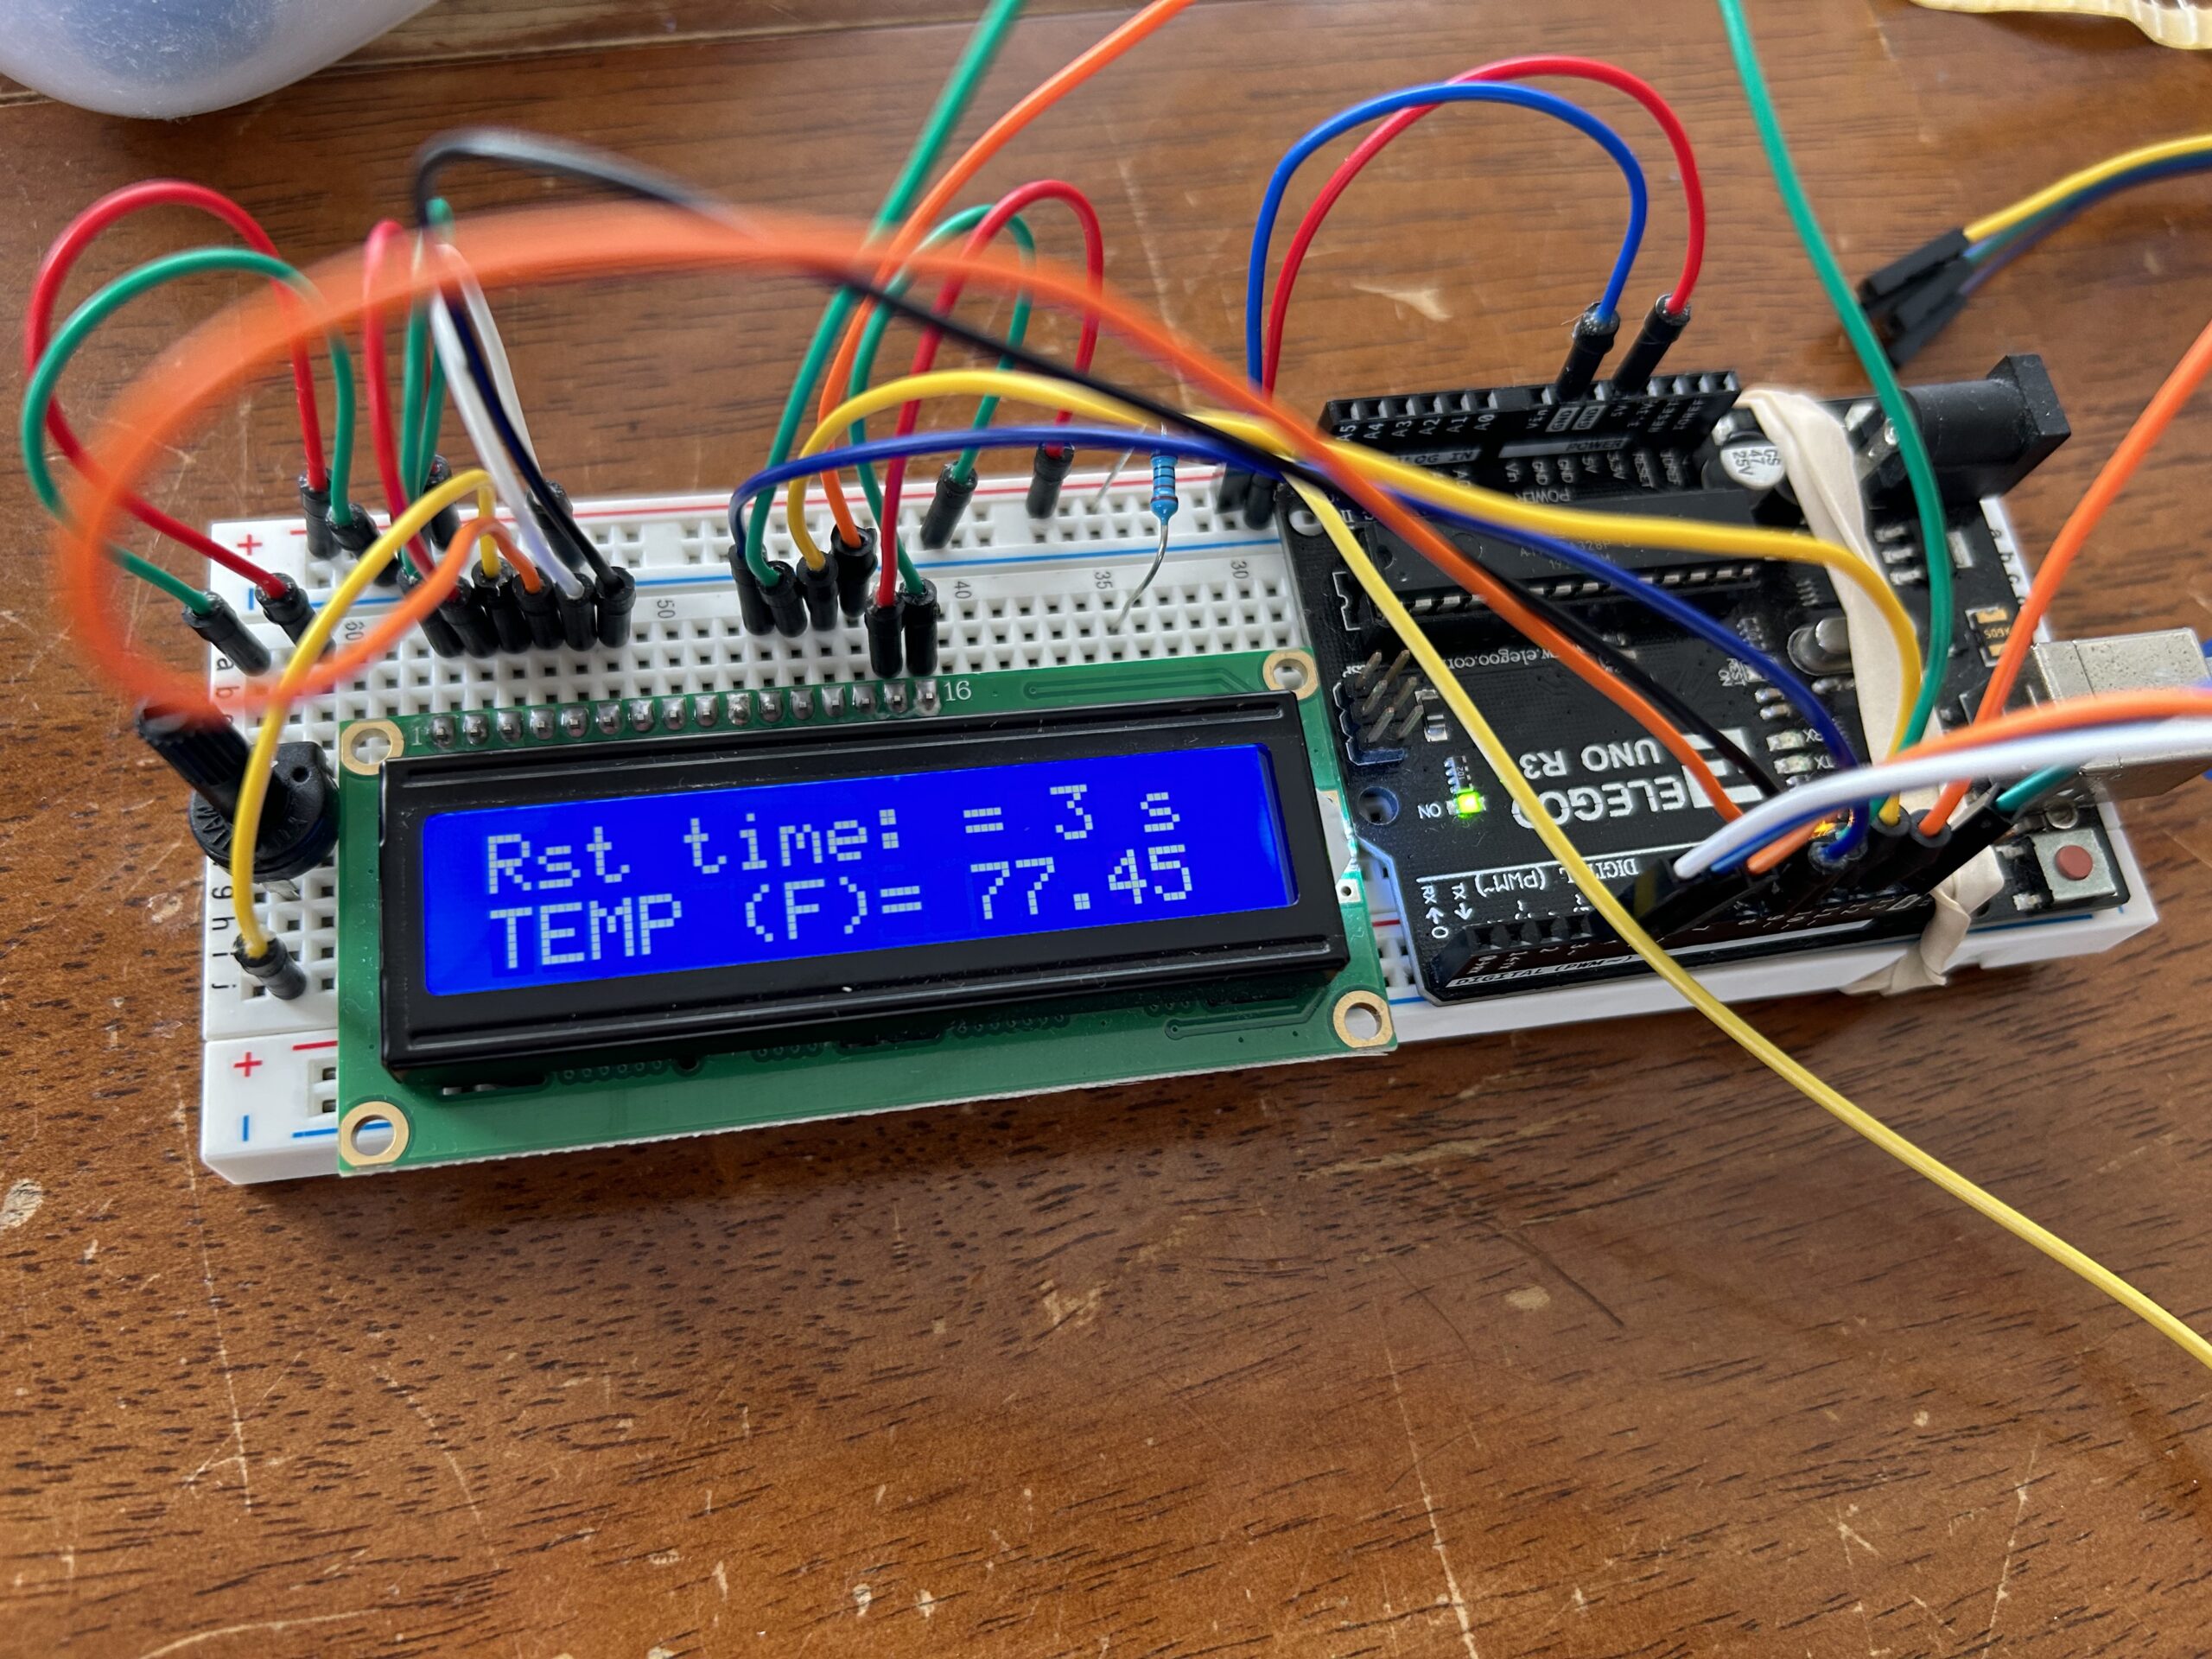
Temperature seems important. OK, I can handle that with a thermocouple. My buddy uses a thermocouple attachment to his multimeter, but he has to keep inserting it and pulling it out–lame. I can get continuous data readings if I stick a homemade thermocouple setup in there the whole time. I could even wire up an LCD display to show roast time, current temperature, etc. I’ll just build one.
Thermocouple Datalogging
For the thermocouple setup, I am using:
- Arduino UNO
- MAX6675 thermocouple cold-junction compensated K-type thermocouple-to-digital converter
- K-type thermocouple (Amazon sells a MAX6675 and thermocouple kit)
- 2×16 LCD display
- 10 kΩ potentiometer
The Build
I wired up the Arduino and thermocouple kit in no time. For my first few tests, I had the serial monitor on Arduino IDE output temperature readings every second, but changed that since then to every 0.25 second (the max stated frequency the MAX6675). The wiring schematic is shown in Figure 3 including the LCD. Here is a good tutorial for help with the LCD setup using the native LiquidCrystal library. My code is presented at the end of this post.

Figure 3. Wiring diagram (created using Wokwi).
The MAX6675 converter is not shown on the Wokwi diagram in Figure 3. This diagram only shows three pins; the MAX6675 has five.The correct diagram for the MAX6675 converter is given in Figure 4.

Figure 4. Correct wiring schematic for MAX6675 amplifier [2]
The Experiment
For now, I am keeping things simple. I roasted several batches of each bean group (see Table 1) and recorded temperature profiles and mass loss for each run, aiming for a Full City+ to French roast for each. Green beans being used for the current studies are all single origin and purchased through Sweet Maria’s Coffee and have been kept tightly sealed and out of direct light at room temperature. I planned to make dark roasts, which work well with my espresso machine setup. The SWP Decaf was roasted twice on different days, and ambient temperature and humidity differed by acceptable amounts (7.26% and 9.0%, respectively). These changes are acceptable considering the low fidelity of these early tests.
Table 1. Test beans
| Origin | Bean | Planned Roast Level |
|---|---|---|
| Guatemala | Antigua Pulcal Inteligente | Full City+ / French |
| Guatemala | Proyecto Xinabajul Urizar de Leon | French |
| Guatemala | Xinabajul Libertad SWP Decaf | French |
| Nicaragua | Buenos Aires Los Pinos | French |
Mass before and after roasting was measured using a Greater Goods coffee scale (model #0460) with a resolution of 0.10 g, thus any uncetainty in mass measurements are +0.04 g and -0.05 g. The thermocouple setup was purchased on Amazon: HiLetgo DC 3-5V MAX6675 Module + K Type Thermocouple Temperature Sensor Thermocouple Sensor Set M6 Screw for Arduino. All other Arduino components came from an Arduino Uno Starter Kit. The thermocouple resolution is given at 0.25 °C, and uncertainty is about half a degree F. For the purposes of these tests, measurements were rounded to the nearest whole degree (F).
The roast timer was set to start when the Arduino booted up, and the Arduino and popper were started at the same time via surge protector switch. All code is available in the Appendix section below.
In general 1/2 cup (70-96 g) green beans were placed inside the popper chamber. The lid was closed and the thermocouple was inserted so the sensor was just under the surface of the top layer of beans in the middle of the cylinder. If the beans were not spinning during roasting, the thermocouple was adjusted so the beans would spin freely.
Roasting was performed by the following algorithm:
- Measure and weigh beans.
- Place beans in roaster, install thermocouple, close lid.
- Switch on, Arduino immediately begins measuring, roaster fires up.
- Take data point manually every 10 seconds.
- Record first crack time and temperature.
- Once target temperature is reached, immediately switch off system and transfer beans to cooling tray; swapping between two cooling trays rapidly to cool beans.
- Once beans have cooled and as much chaff as possible has been removed, take post-roast weight.
- Adjust plan as necessary and repeat with next batch.
- Once cool, all roasted beans are placed in pint mason jars with loose lids.
- After 24 hours, the plastic mason jar lids are sealed.
- Tasting will start at the five-day mark.
All data was recorded using Microsoft Excel.
Espresso machine used is a Handpresso Wild Hybrid with intense filter; 3D-printed tamper. Roughly 7 g coffee to 25 g coffee ratio (best obtainable with setup). Extraction time 19-25 seconds; consistent. Soon I will be using a Rancilio Silvia with PID controllor. All coffee was ground immediately before brewing in a Rancilio Rocky grinder; grind size roughly 500 μm. Taste profiling during cupping is currently underway, but results so far will be shared and discussed.
Results
Figures 15-13 are the raw temperature profiles for each run. Note the roast ID value and associated tabulated results in Table 2.
Table 2. Test results
| Bean | ID | Roast Date | Ambient Temp (°F) | Ambient Humidity (%) | Target Mass Loss (%) | Mass Loss (%) | Final Roast Temp (°F) | Percent Error |
|---|---|---|---|---|---|---|---|---|
| Guat. Antigua Pulcal Int. | GAP01 | 9/1/24 | 78.5 | 85 | 15.6 | 15.66 | 451 | 0.3846 |
| Guat. Antigua Pulcal Int. | GAP02 | 9/1/24 | 78.5 | 85 | 15.6 | 15.76 | 450 | 1.026 |
| Guat. Antigua Pulcal Int. | GAP03 | 9/1/24 | 78.5 | 85 | 15.6 | 15.64 | 450 | 0.2564 |
| Nicaragua Buenos Aires | NBALP01 | 9/1/24 | 78.5 | 85 | 15.6 | 15.29 | 452 | 1.987 |
| Nicaragua Buenos Aires | NBALP02 | 9/1/24 | 78.5 | 85 | 15.6 | 16.02 | 460 | 2.692 |
| Nicaragua Buenos Aires | NBALP03 | 9/1/24 | 78.5 | 85 | 15.6 | 15.36 | 455 | 1.538 |
| Guat. Xinabajul SWP Decaf | XINDECAF01 | 9/1/24 | 78.5 | 85 | 15.6 | 15.42 | 450 | 1.154 |
| Guat. Xinabajul SWP Decaf | XINDECAF02 | 9/3/24 | 73 | 93 | 15.6 | 16.96 | 455 | 8.718 |
| Guat. Proyecto Xinabajul | GPROXINA01 | 9/3/24 | 73 | 93 | 15.6 | 15.43 | 450 | 1.090 |

Figure 5. GAP01 test run

Figure 6. GAP02 test run

Figure 7. GAP03 test run

Figure 8. NBALP01 test run

Figure 9. NBALP02 test run

Figure 10. NBALP03 test run

Figure 11. XINDECAF01 test run

Figure 12. XINDECAF02 test run

Figure 13. XINAPROYECTO01 test run

Figure 14. Percent error across all tests using 15.6% mass loss as a target value
The taste testing is currently underway. Besides general taste quality, the main variable of interest is flavor quality over time. Each batch is tasted after the first week, then the second week, then the third, and so on. The idea is to determine the shelf time of each roast by flavor profiles.
So far, the taste across all roasts has improved in the second week over the first week. Grind smell is richer across all roasts at the fifteen-day mark, and most of the second run batches are not yet exhausted. Overall, the flavor profile is better after fifteen days than after five days.
Discussion
One noticable trend in the data can be seen in Figure 15. Notice that runs 1 and 3 for the Guatemala Antigua and Nicaragua Buenos Aires batches followed similar curves. The first runs always started at ambient room temperature, but the roaster was already warm before the second and third runs, which is clear from the difference in final roast times for GAP02 and GAP03 when compared with the first Antigua run (GAP01), the first run of the test day. The NBALP02 run had a larger error due to an overshoot on final target temperature (see Table 2).
The large change in percent error for the decaf bean can be attributed to different roast days; the ambient temperature and humidity were different and the target temperature was five degrees F higher than the first. In future tests it would be wise to avoid multiple day roast sessions for simliar beans, or use statistical blocking to remove day effects.
Because of time constraints, only one batch of the Proyecto was completed, but the percent error was acceptable for the first run. More tests are needed for all beans, but especially the Proyecto.
Since the main effect being tested is cupping quality as a function of shelf life, let’s look at some of the factors that affect coffee flavor degradation, if any exist.
Freshly roasted coffee produces carbon monoxide (CO) and carbon dioxide (CO2) Sweet Maria’s claims that freshly roasted coffee needs between 12-24 hours to rest before brewing, but that there is a noticeable flavor reduction around the seven-day mark [1]. A quick Google search for “coffee degassing home roasting shelf life” reveals quite a discrepancy between roasters on the ideal brewing window for fresh epsresso roasts. For example: an Ikawa Home article gives the ideal rest-degas time is 10-14 days [4], BroadSheet Coffee Roasters says 1-6 weeks [5]. Coffee Roast Co. gives a not-terribly-useful range of 24 hours to 12 months [6]. Still others claim that 7-14 days after roasting is ideal for espresso [7,8]. On average, the home roasting community takes a “it depends on the bean, roast, and preference” approach.
Scholarly work on this subject provides clearer insight into why coffee degrades at all after roasting. Carbon dioxide is produced as a result of many reactions that take place during coffee roasting, and though some of this CO2 is released during roasting and upon grinding, some is trapped in the beans and is slowly released [10]. Carbon dioxide makes up 87% of the gases released from coffee beans during roasting [9] and depends upon the type of coffee and roast conditions. Carbon dioxide formed during roasting slowly diffuses out of the beans and affects flavor. During roasting, the beans develop internal cavities and other structural changes that affects CO2 diffusion post-roasting [11]. One study found, by accident, that coffee that had a newer (fresher) roast date than other beans tested exhibited a much stronger outgassing rate; so much that the sample was considered an outlier to the test [13]. This implies a waiting period before brewing would be indicated if users wanted to avoid CO and CO2 gases during cupping.
In other studies, trapped gases (both CO2 and CO) were found to continue releasing from beans for over 60 to 100 days [13]. This would support some popular opinons among roasters that longer waiting times will yield better-tasting brews.
In this study, I stopped short of a quantitative assessment in taste during cupping, settling for a more relaxed approach: I am simply trying the coffee, enjoying the experience, and making mental notes as I work slowly through the batches. As of this writing, the first week batches developed more visible moisture (especially on the Buenos Aires roasts) than during the first six days. Second week batches show even more external moisture on these beans, and all batches smell and taste noticably “better” (in my opinion) than the Week 1 batches. I have been trying all batches more or less equally; being careful to cup at similar times of the day while cleansing my palatte between brews.
Conclusion
A precedent exists for coffee flavor as a function of time since roasting in both the coffee roasting community and scholarly literature. Carbon monixide and carbon dioxide are primary outgassing products from coffee roasting processes which can affect flavor profile during cupping, and high rates of these products are commonly associated with poor flavor. This work has found a qualitative correlation between time since roast and smell and taste profiles for french roasts (15.5% mass loss) and errors for most batches tested were acceptably low. At the end of week 2, whole bean and grind smell improved, along with flavor profile, according to the author’s unique desires. Week three batches will be consumed soon and evaluated. Updates will be posted as new blog posts. Future work will incorporate similar batch testing on the same day to avoid confounding (or will add statistical blocking) in roast conditions. Three roasts per variety on the same day seems adequate. The Arduino thermocouple setup seems appropriate and the target temperature method of determining roast level (as verified by mass loss %) is accurate to the desired roast mass loss to a percent error of 0.25% at best, and 2.69% (removing an obvious outlier).
The work by [10] is interesting and indicates that CO2 outgassing decreases exponentially following grinding. Interestingly, nearly every barista knows that grinding beans immediately before brewing espresso (not waiting some period of time) produces the best coffee, on average. Is it possible some desireable characteristic exists that is correlated to CO2 retention for post-grind coffee? If that is the case, when do the undesireable qualities of CO2 in freshly roasted beans become desireable for espresso extraction, if such a mechanism exists? It seems to me that it would be helpful to develop a table of CO2 offgassing rates by bean origin, that is, by location. It would be virtually impossible to test every new variety and green bean produced, but if such a database were compiled with respect to roast level and bean origin, it may be a useful guide to roasters. I am not aware of such a database as of this writing. Techniques and models similar to those used by [10] could be used for whole bean coffee starting immediately post-roast.
A Note
When I sat down to write this post, I thought to myself, “It will be nice to write a brief little thing about how much fun I am having roasting coffee and using an Arduino setup.” It wasn’t long before I had an introduction, a motivation section, a results section, and… uh oh, I am writing a paper. It just naturally came out of me; to write in this way. I love the art of a scientific paper, and I love the research and learning involved in it. Before long I found myself with ten or so references, and I realized I had been writing this for three days… and I decided I needed to get back to some other projects. The final straw came as I was working through a MATLAB script that plotted my roast outgassing levels with time using an experimentally-derived model that I found in literature… while I love every minute of this… I had to stop.
But I learned how LaTeX works (and does NOT work) with WordPress sites, how I need to dust off my vpasolve() MATLAB skills, and how several Naval Surface Warfare engineers had the coolest job in the world (as if they didn’t already) for a few months as they worked on a coffee roasting outgassing paper. Seriously, there are some cool papers out there on this stuff.
Hope you enjoyed this as much as I did!
References
[1] Sweet Maria’s Coffee. https://www.sweetmarias.com/
[2] Random Nerd Tutorials. Arduino: K-Type Thermocouple with MAX6675 Amplifier. https://randomnerdtutorials.com/arduino-k-type-thermocouple-max6675/
[4] Jackson, Emily. “Roasting Coffee Beans at Home: Degassing, Storing and Tasting.” Ikawahome.com, IKAWA Home, 17 Nov. 2021, ikawahome.com/blogs/home/roasting-at-home-degassing-storing-and-tasting?srsltid=AfmBOorrp5ewbuE2Y7DTJu4X_obPIrMvzigPipTLxZpY3y4JpCxk_Qxx. Accessed 16 Sept. 2024.
[5] Nast, Condé. “Please, Don’t Store Your Coffee Beans in the Fridge.” Epicurious, 2 Mar. 2023, www.epicurious.com/expert-advice/storing-coffee-beans.
[6] Yu, Justine. “How Long Do Coffee Beans Last? Do These Storage Tips to Keep Them Fresh!” CoffeeRoast Co., CoffeeRoast Co., 25 Apr. 2023, coffeeroastco.com/blogs/coffee-roast-co-blog/how-long-do-coffee-beans-last?srsltid=AfmBOooVHQbiovt-DoPGN93h5qlrPWNXXGKYONrsDBi02VXv1ppAtpb2. Accessed 16 Sept. 2024.
[7] coffeellera. “Coffee Degassing Guideline.” Coffeellera, 9 Aug. 2019, www.coffeellera.com/blog/coffee-degassing-guideline-importance-and-storing/?srsltid=AfmBOoqnECb07DFspNzzbL5w38_xXKLdswMop2X0JMjE5lUfWMGGFtyC. Accessed 16 Sept. 2024.
[8] GreenplantationCom s.r.o. “Freshly Roasted Coffee: What Is Degassing and When to Drink Coffee after Roasting? :: Green Plantation.” Www.greenplantation.com, 24 June 2023, www.greenplantation.com/a/freshly-roasted-coffee-what-is-degassing-and-when-to-drink-coffee-after-roasting?srsltid=AfmBOooTf218wuF1CEp9WSJ24rvlHxW0hmaRkQ4M1YTG83ZKCudApJbc. Accessed 16 Sept. 2024.
[9] Clarke, R. J., & Macrae, R. (Eds.). (1987). Coffee: Related Beverages (Vol. 5). Springer Science & Business Media.
[10] Anderson, B. A., Shimoni, E., Liardon, R., & Labuza, T. P. (2003). The diffusion kinetics of carbon dioxide in fresh roasted and ground coffee. Journal of Food Engineering, 59(1), 71-78.
[11] Massini, R., Nicoli, M. C., & Cassarà, A. (1990). Study on physico-chemical changes of coffee beans during roasting. Note 1. ITALIAN JOURNAL OF FOOD SCIENCE, 2, 121-128.
[12] Crank, J. (1979). The mathematics of diffusion. Oxford university press.
[13] McCarrick, A., Letter, B., O’Dwyer, S., Knighton, M., & Neal, S. (2019). Carbon monoxide release from whole bean roasted coffee in storage. In 49th International Conference on Environmental Systems, Boston, MA. Available at https://ttu-ir. tdl. org› bitstream› handle› ICES-2019-172.
Appendix – Arduino Code
For anyone interested in the Arduino code, here it is. Note that I hard-coded the roasting levels based on the Sweet Maria’s temperature chart for reference, and had the LCD screen display the levels. I found the roast time and instantaneous temperatures invaluable and the associated roast level industry name to be less useful, but still fun when friends come over to watch the roast.
/*
Thermocouple for coffee roasting with LCD
Author: Justin Self
Special thanks to the LiquidCrystal library template
Roast temperatures based on Sweet Maria's Coffee Roasting Level Card
*/


// include the library code:
#include <LiquidCrystal.h> // lcd display
#include "max6675.h"       // MAX 6675 thermocouple device

// setup thermocouple input pins
int thermoSO = 4;
int thermoCS = 5;
int thermoSCK = 6;


MAX6675 thermocouple(thermoSCK, thermoCS, thermoSO);

// setup LCD screen
// initialize the library by associating any needed LCD interface pin
// with the arduino pin number it is connected to
const int RS = 7, E = 8, d4 = 9, d5 = 10, d6 = 11, d7 = 12;
LiquidCrystal lcd(RS, E, d4, d5, d6, d7);

void setup() {
  Serial.begin(9600);
  Serial.println("MAX6675 test");
    // set up the LCD's number of columns and rows:
  lcd.begin(16, 2);
  // wait for MAX chip to stabilize
  delay(500);
}

void loop() {
  // Print the current temp (useful if connected to computer)
   //Serial.print("C = ");
   //Serial.println(thermocouple.readCelsius());
   Serial.print("TEMP (F)= ");
   Serial.println(thermocouple.readFahrenheit());

   // For the MAX6675 to update, you must delay AT LEAST 250ms between reads!
   delay(500); // print every 500ms

  ////////////////// LCD DISPLAY /////////////////////////////////
    // (note: line 1 is the second row, since counting begins with 0):
    // top line = (0,0)
    // bottom line = (0,1)

    // BOTTOM ROW
    lcd.setCursor(0, 1);    // bottom row: display temperature in F
    lcd.print("TEMP (F)= ");
    lcd.print(thermocouple.readFahrenheit());

    // if Celsius desired, comment out lines 47-48 and use the following two lines instead
    //lcd.print("TEMP (C) = ");
    //lcd.print(thermocouple.readCelsius());

    // TOP LINE
    // CONDITIONAL LOGIC THAT DISPLAYS ROAST LEVEL
    lcd.setCursor(0, 0);      // define top row
      if(thermocouple.readFahrenheit()<=412) { // 412 - 418
        lcd.print("Rst time:   ");
        lcd.print(millis() / 1000);
    }
    else if (thermocouple.readFahrenheit()<418) { // First crack
      lcd.print("First Crack ");
      lcd.print(millis() / 1000);
    }
    else if (thermocouple.readFahrenheit()<425) { // City- (418,425)
      lcd.print("City-       ");
      lcd.print(millis() / 1000);
    }
    else if (thermocouple.readFahrenheit()<432) { // City (425,432) ideal range = (last statement, this statement max)
    lcd.print("City        ");
    lcd.print(millis() / 1000);
    }
    else if (thermocouple.readFahrenheit()<438) { // City+ (432,438)
    lcd.print("City+       ");
    lcd.print(millis() / 1000);
    }
    else if (thermocouple.readFahrenheit()<442) { // Full City (438,442)
    lcd.print("Full City   ");
    lcd.print(millis() / 1000);
    }
    else if (thermocouple.readFahrenheit()<448) { // Full City+ (442,448)
    lcd.print("Full City+  ");
    lcd.print(millis() / 1000);
    }
    else if (thermocouple.readFahrenheit()<455) { // French (448,455)
    lcd.print("French      ");
    lcd.print(millis() / 1000);
    }
    else if (thermocouple.readFahrenheit()<460) { // Burnt (455,460)
    lcd.print("Burnt       ");
    lcd.print(millis() / 1000);
    }
    else if(thermocouple.readFahrenheit()>460) { // 455
    lcd.print("*WARNING*   ");
    lcd.print(millis() / 1000);
    }


} // end loop